Download practice file
In today’s finance world, Excel is more than just a tool; it’s an essential skill that drives data analysis, budgeting, forecasting, and strategic decision-making. For professionals in FP&A (Financial Planning and Analysis) and accounting, Excel mastery is crucial. But what are the core skills you need, and how can you make the most out of Excel’s powerful features? Let’s dive in.
Why Excel is Critical for FP&A and Accounting
From organizing data to performing complex financial analysis, Excel provides the versatility and functionality that finance professionals depend on. Here’s why it’s indispensable:
- Data Analysis and Reporting: Excel’s formulas and pivot tables allow finance professionals to quickly analyze and interpret large datasets, transforming raw data into meaningful insights.
- Forecasting and Budgeting: Excel offers a suite of functions for modeling future performance, helping businesses make data-driven forecasts and create realistic budgets.
- Streamlined Workflows: With shortcuts and automation tools like macros, Excel allows you to save time and reduce manual errors, streamlining repetitive tasks.
- Decision Support: Excel’s flexibility lets you build financial models that assess profitability, evaluate investment options, and make informed financial decisions.
Core Excel Skills Every FP&A and Accounting Professional Should Master
Here are some of the top Excel skills and functions you need to become highly effective in FP&A and accounting:
1. Data Manipulation and Cleaning
Handling large datasets is a daily task in finance. These functions are essential:
- FILTER, SORT, and UNIQUE: Quickly filter data, sort it in specific orders, and remove duplicates for a clean dataset.
- TEXT Functions (e.g., LEFT, RIGHT, MID): Extract specific information from text fields (like codes or IDs) for easier analysis.
- IFERROR: Handles errors gracefully, ensuring that your reports look professional even when data is missing or inconsistent.
2. Key Formulas for Calculations
Basic yet powerful formulas form the foundation of financial analysis in Excel:
- SUM, AVERAGE, MIN, MAX: Essential for calculating totals, averages, and finding the highest and lowest values in datasets.
- IF and Nested IF Statements: Set conditions in calculations, allowing you to create logic-based reports or flag values based on criteria.
- COUNTIF and SUMIF: Useful for counting and summing cells based on specific criteria, making it easier to analyze trends in data.
3. Advanced Lookup Functions
Lookup functions save you from manual data entry and ensure accuracy:
- VLOOKUP and XLOOKUP: Quickly find data from different tables or datasets. XLOOKUP, in particular, offers more flexibility and replaces VLOOKUP’s limitations.
- INDEX and MATCH: More versatile than VLOOKUP, this combination allows for dynamic lookups, especially useful in multi-dimensional datasets.
4. Pivot Tables and Pivot Charts
Pivot Tables are a finance professional’s best friend. They help you summarize data quickly, enabling insightful analysis with minimal setup. With Pivot Charts, you can visually represent data trends, making your reports more engaging and easy to interpret.
5. Data Visualization
Presenting data in an accessible, visual format is key to communicating insights:
- Conditional Formatting: Highlight cells based on specific conditions (e.g., budget variances, red for expenses over budget), making data trends easy to spot.
- Charting: Use bar charts, line charts, and pie charts to represent financial data visually, allowing decision-makers to grasp insights at a glance.
6. Forecasting and Scenario Analysis
Advanced forecasting skills help finance professionals make predictions based on historical data:
- FORECAST.LINEAR and FORECAST.ETS: These functions allow for forecasting based on linear trends or seasonality, useful for planning sales, expenses, and cash flow.
- Scenario Manager and Data Tables: Analyze how changes in key inputs affect financial outcomes, enabling you to make better strategic decisions.
7. Automation with Macros
Macros allow you to automate repetitive tasks, making your workflow faster and more efficient. They’re particularly useful for tasks like formatting reports, refreshing data, or running multiple calculations at once.
Pro Tips for Mastering Excel in FP&A and Accounting
1. Practice Consistency in Formatting and Organization
- Consistent formatting—like standardized fonts, colors, and number formats—makes spreadsheets easier to read and reduces errors. Organizing your data logically also helps you locate information faster.
2. Embrace Keyboard Shortcuts
- Mastering shortcuts (like Ctrl + Shift + L for filters or Alt + = for autosum) saves time and reduces reliance on the mouse, allowing for a faster, smoother workflow.
3. Use Templates for Recurring Tasks
- Templates for budgeting, forecasting, and variance analysis allow you to focus on data input rather than setup, helping you save time and maintain accuracy across reports.
4. Make Use of Named Ranges
- Named ranges allow you to label cells or cell ranges, making formulas easier to understand and manage. This is particularly useful in complex workbooks with multiple data sets.
5. Keep Learning!
- Excel has a vast range of capabilities, and the more you learn, the more value you can bring to your role. Explore new functions, stay updated on Excel’s latest features, and continually practice your skills.
The Bottom Line: Excel is Essential for Success in FP&A and Accounting
Excel is a powerful tool in the finance and accounting fields. By mastering the essential skills and advanced techniques outlined here, you can increase your productivity, reduce errors, and make a bigger impact in your organization. Whether you’re just starting out or looking to enhance your expertise, a solid foundation in Excel is a must-have for any finance professional.
Ready to Level Up?
Explore our Excel crash course to gain hands-on practice with these functions and take your Excel skills from basic to advanced. With dedication and practice, you’ll be well-equipped to tackle any financial analysis task that comes your way.


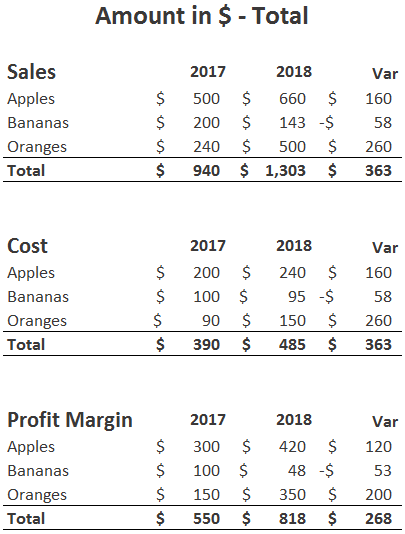
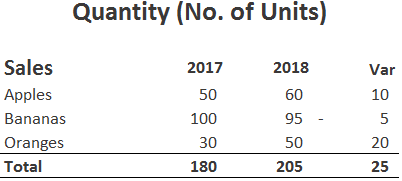
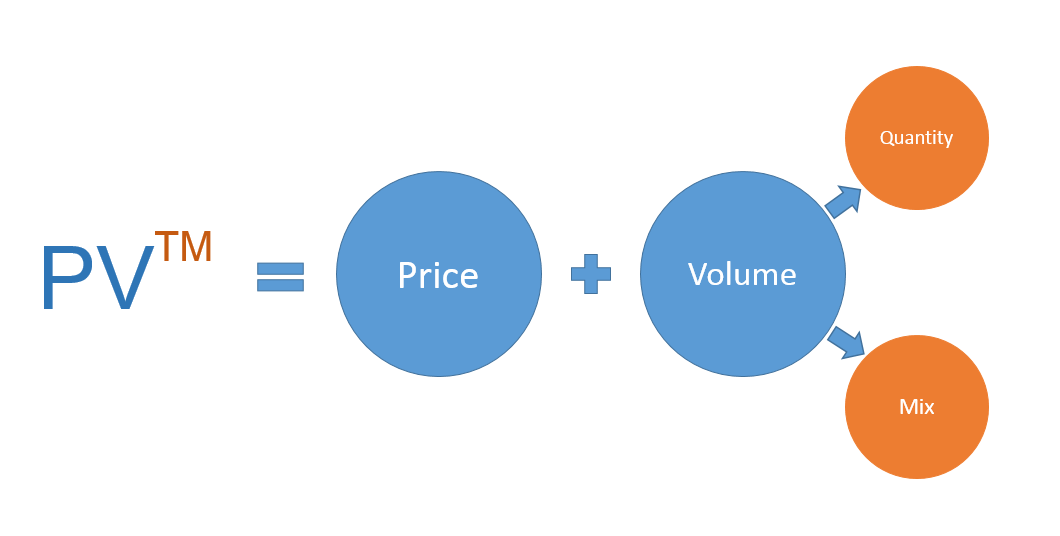
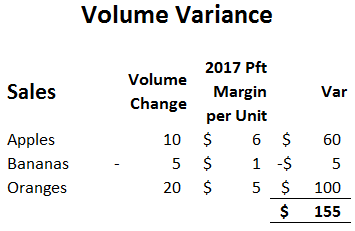
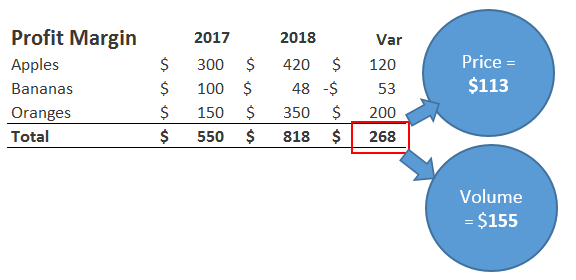
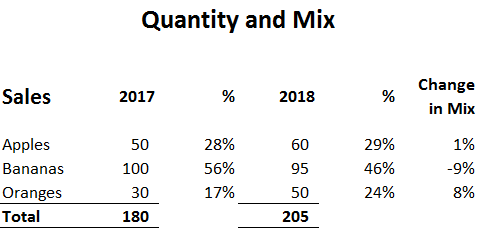
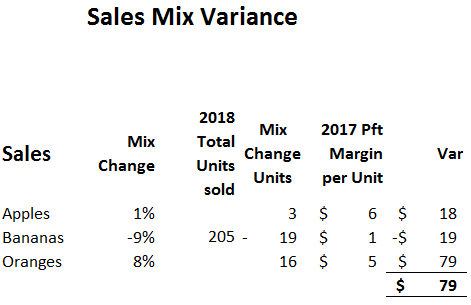
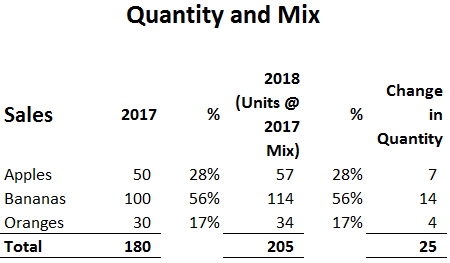
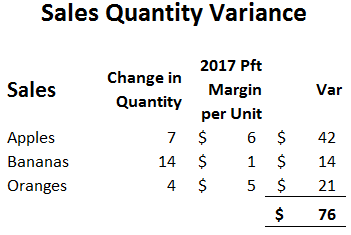
 Types of Sales Variances