How to explain the impact of Sales Variances on Profitability or Profit Margin of a business? In this article, I am going to explain with the help of an example, how to calculate sales variances, and how to understand the impact of these variances on the profitability of your business. Note that we are calculating the impact of Sales Variances on Profit. This is different from explaining sales variances on Sales $.
Note: If you would like to learn in detail, how to calculate all income statement variances and the impact they have on sales, gross profit and ebitda, both in $ and %, and how to explain performance vs budget and prior periods, click here for a detailed video course (at a special price for readers of this post) showing exactly how this is done. You will also learn how to analyse and present the results of the variances to management and will be able to download solved variance calculation Excel files.
By the time, you are finished with the article, you will be able to understand clearly how to calculate these variances. I will try to be concise, so I assume you are already aware of terms like Sales, margin, profits and variance etc. If you are not fully aware, click on Commonly used financial terms every new Financial Analyst and Accountant should know! where I explain these and other commonly used terms. Also, start following our blog and YouTube channel LearnAccountingFinance, so that you can stay up to date with practical information and training (knowledge you can use immediately at your work).
What you will learn?
We will start with data in the following example. The example uses data for 2017 and 2018 (current year vs last year) to calculate the variances. However, if you are trying to calculate variances versus budget, simply replace last year (2017) with Budget data and the calculation will work just fine.
In this example, we are selling three products which are 1) Apples, 2) Bananas and 3) Oranges. We have data for Sales, Cost of Sales and Profit margins. We also have the quantity, or number of units sold. See Tables below


As this article is about calculating the impact of Sales variances on Profit margins, we have deliberately kept the cost per unit as same over the two periods to avoid confusion. However, when calculated correctly, it does not matter if cost per unit has changed. As you will see in the calculations, sales variance calculations do not take into account change in costs. The only thing to consider in that case would be that the profit margin change would have an element of variances from costs as well which needs to be calculated separately (cost variances). In our example however, the profit margin increased by $268 and all of it is resulting from Sales related variances. After performing all variance calculations, you will see the split of variances as follows:
 Types of Sales Variances
Lets look at types of sales variances quickly. Broadly, there are only two types of Sales variances.
- Price Variance (Change in Selling Price)
- Volume Variance (Change in Volume)
The Volume variance is further sub-divided into Quantity and Mix Variances. Do you like acronyms. Here is a good one to remember. Its PVTM
Accounting Explained in 100 Pages or Less: https://amzn.to/3rCProc
Sales Variance
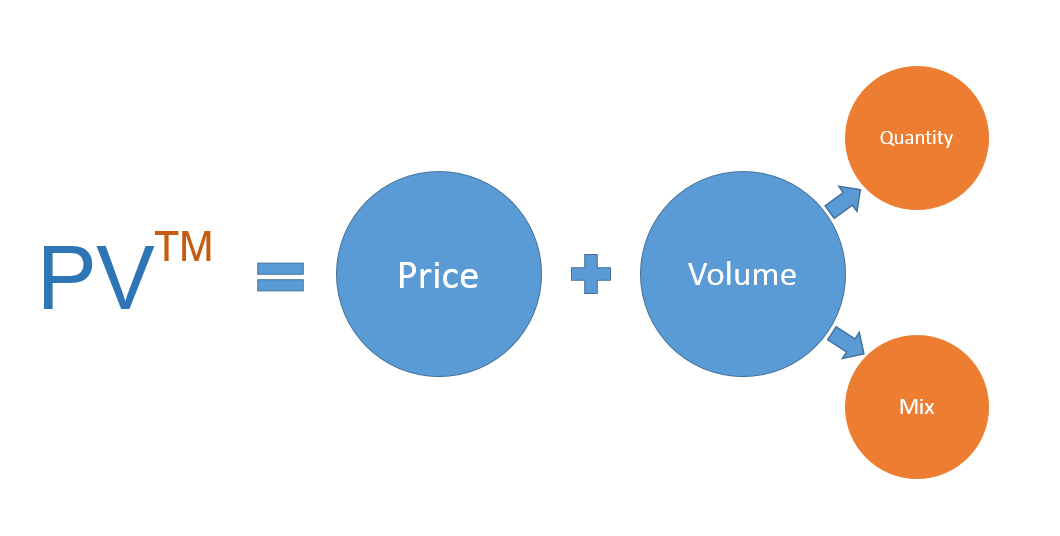
where ‘P’ is for Price Variance, and ‘V’ is for Volume Variance. ‘T’ for Quantity and ‘M’ is for Mix.
If we calculate our variances correctly, the sum of Price and Volume variances should be equal to the total change in Profit Margin (excluding the impact of cost variances). Similarly the sum of Quantity and Mix variances should equal Volume variance. Its time to calculate each of these variances individually.
Selling Price Variance
Lets deal with Price variance first. Any change in price directly impacts Profit margin. From the data available, you can easily calculate the selling price per unit of each fruit (Amount of Sales ($) for each fruit sold divided by the number of units sold). So, for example for Apples, the selling price for 2018 is $11 ($660 Sales / 60 units sold). Similarly, the selling price of apples in 2017 was $10. Below is the table of selling prices per unit.

Looking at the table above, we can clearly see that the Selling price for apples and oranges have increased in 2018 compared to previous year, while that of bananas has decreased. This means, if we look at selling prices alone, we should see a favorable impact, or favorable variance from apples and oranges and unfavorable impact from bananas. Now, Selling Price variance will be calculated as follows:
(2018 Selling price – 2017 Selling price) x Units sold in 2018.
For apples, this can be calculated as:
($11 – $10) x 60 units = $60 Fav.
Why did we use 2018 number of units sold, and not 2017 units? The answer is that we are trying to determine the impact of change in Selling price. In other words, we are trying to see if the 60 apples sold in 2018 were sold at 2017 price, how would this compare with 2018 price. Therefore, the variance could also be calculated as follows:
Apples sold at 2018 Price – Apples sold at 2017 Price
which is …
($11 x 60) – ($10 x 60) = $60
Apply the same logic to bananas and oranges
Bananas – Sales Price variance = ($1.5 – $2) x 95 = -$48 Unfav. (numbers are rounded)
Oranges – Sales Price variance = ($10 – $8) x 50 = $100 Fav
Here is the summary of Selling price variances,
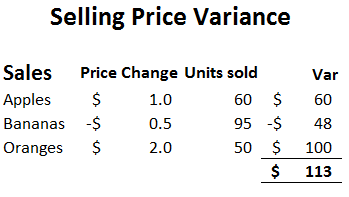
So, we can say out of total change in profit margin of $268, Price variance represents $113 (rounded), and we can also see that oranges are the largest contributors to the fav. price variance.

Volume Variance:
This leads to the calculation of our second variance; Sales Volume variance. Sales variances comprise of Price and Volume only. Since we have calculated Price variance already, we can already calculate the total volume variance which would be…
Sales Volume variance = Total Sales Variance – Sales Price Variance
$268 – $113 = $155
However, we need to still calculate it, as well as the two sub Volume variances, which are Quantity and Mix.
Lets start with Volume variance.
Sales Volume Variance =
(2018 Units Sold – 2017 Units Sold) x 2017 Profit Margin per Unit
Yes, I know you have some questions here.
- Why did we use Profit Margin per unit, and not Selling Price?
- OK, even if we use Profit Margin, why 2017 and not 2018.
See .. I can read your mind 🙂
Answer to Question 1. Remember we are trying to explain the impact of Sales variances on profit margin, not total Sales $. If we had taken Selling price instead of Profit margin, we would be explaining Sales $ variance (change in Sales $ from 2017 to 2018), but we are calculating the impact on Profit margin. For each increase or decrease in unit sold vs last year, the profit margin will be impacted only by the amount of profit margin per unit and not the total Sales value. Understanding this is important. Note that in the calculation of two sub Volume variances (Mix and Quantity) as well, we will use profit margin per unit and not Selling price per unit.
If you have understood answer to Q1, then you can also understand that when we calculated price variance, we took into account the change in profit margin per unit in 2018 (change in selling price directly impacts the profit margin). Now we are calculating the impact of change in volume (or number of units) and should exclude the impact of change in Profit margin in 2018. This is why we use 2017 Profit Margin. Think about it for a little while, internalize it and if you still do not understand, leave a comment and I will try to explain further.
Time to do the Math:

At this point, we have understood the impact of Sale price and volume on the $268 change in Profit Margin in 2018 vs 2017.

However, our analysis is not finished, and we need to understand the impact of Mix and Quantity.
Sales Mix Variance:
Sales Mix refers to the share of each product in total Sales, in terms of percentage. If you look at the number of units sold, you will see that in 2017, 50 apples were sold which is 28% of total sales of 180 units (50/180).

Sales Mix variance can be calculated as …
(2018 Mix % – 2017 Mix %) x Total units sold in 2018 x 2017 Profit Margin
So, our Sales Mix variance for each fruit will be as follows:

The share of apples in the overall product mix increased to 29% in 2018 (60/205). This change in mix of 1% multiplied by the total number of units sold in 2018 (205) will give us the number of apples sold that resulted in the increase in Mix %. In this case it is 3 apples (1% x 205 = 3). We know that the total number of apples increased by 10 (50 in 2017 and 60 in 2018). So out of the total Volume change of 10 apples, 3 apples represent Mix change and the remaining 7 represent Quantity change. We can see from the variances above that a drop in mix % of bananas by -9% has impacted the profit margin unfavorably by -$19 but this has been more than compensated by the increase in Mix % of Oranges by 8% (which has a higher Profit margin per Unit compared to bananas).
Calculating Mix variance separately in this way is important because each product has a different profit margin. Assuming the overall volume increased from 180 to 205 (just as in our example) but the mix remained the same as last year, then the change in total profit margin of the business would have been different, although we see the same quantity increase. This calculation of impact of increase in quantity while maintaining the same mix as last year is really our next variance, the Quantity Variance. Calculating Mix variance also helps when trying to explain Profit Margin % changes over the years, or vs budget because Quantity variance has neutral impact on % Profit Margin.
Need more clarity? Wondering how to apply this information to your unique situation. Book a session with me so we can discuss if I can provide you one on one training or solve your specific variance analysis challenge. Find a spot on my calendar and book now: calendly.com/learnaf
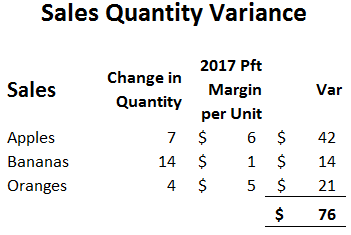
Sales Quantity Variance
As mentioned above, Sales Quantity variance measures the impact of increase in volume, or quantity while maintaining previous year’s mix.
Sales Quantity Variance
= (2018 Units sold @ 2017 Mix – 2017 Units Sold) x 2017 Profit Margin per unit
In our example fruit sales increased from 180 to 205. If the sale had increased maintaining the same product mix as 2017, our unit sales for 2018 would be as follows:

And the Sales Quantity Variance can be calculated as follows:
Conclusion:
We have calculated all the variances now. The overall increase of $268 in Profit margin can be clearly explained with Price increase resulting in fav. variance of $113 and Volume increase resulting in fav. variance of $155. The volume increase includes $79 due to change in Product Mix.
Note: If you would like to learn in detail, how to calculate all income statement variances and the impact they have on sales, gross profit and ebitda, both in $ and %, and how to explain performance vs budget and prior periods, click here for a detailed video course (at a special price for readers of this post) showing exactly how this is done. You will also learn how to analyse and present the results of the variances to management and will be able to download solved variance calculation Excel files.
If you are also interested in learning how to calculate purchase price variance and the accounting entries involved in recording purchase price variance, click on the link How to calculate Purchase Price Variance (PPV) and track PPV accounting entries in SAP
Are you an accounting and finance professional looking to improve your financial analysis skills? Make sure you connect with me by subscribing to my email list. I will be sharing practical tips and advice that will help you transform you career this year. Click here to subscribe to my email list.
I have a YouTube channel with helpful accounting and finance, Excel and career related videos. You can find my channel by clicking on the link LearnAccountingFinance. Leave a comment if you found this information helpful or if you have any questions!


The mix variance I’m familiar with is a bit different from the one you represented.
In the variation I’m familiar with mix is calculated by multiplying each product Quantity difference by the difference between the average price (of the division/brand depending on the hierarchie you want to analyze) and the price of the product last year or budget price).
The quantity variance is hence also different, difference in quantity x average price of last year or budget.
If you add those up, you get the volume effect.
Maybe your variation is also the same with a bit of algebraic manipulation, I’ll have to write it on paper and see if things convergence to something else I’m familiar with.
Let me know what you think.
LikeLike
Babar, for your mix calculation, you say average price – for which year?
LikeLike
It’s not quite the same – it’s done in a different order.
I found the best way to think about this stuff is to considering stretching a piece of paper width wise and lengthwise simultaneously.
It began at 100 x 50cm.
It finished at 110 x 60cm.
What’s your “area variance”?
Easy, 6600-5,000 = 1,600cm^2
What’s your length and width variances?
It’s actually arbitrary which you do first: if you do length first, you get 10×50 = 500cm^2.
If you width first you get 10×100 =1000cm^2.
There’s 100cm^2 missing! That’s the corner and it will always go into the variance you calculate second.
LikeLike
Hi, I was wondering how you would consider changes in portfolio, for example when you stopped selling bananas last year or started selling apples this year? Thank you and best regards
LikeLiked by 1 person
Thank you for your question. If you follow the calculation in the article above, you will see that when you stop selling bananas this year (deletion in portfolio), the variance will be reflected in the volume variance (under quantity and mix). This is because there is a change in the quantity and mix of the “existing portfolio” of products.
On the other hand, when you start selling apples this year (addition to the portfolio), you will see that the entire variance will be reflected in Sales price variance (in a way reflecting price changed from zero last year to the current price this year). In this way, we can separate the variances related to these products and portfolio changes
from the calculation.
Thanks!
LikeLike
I´m struggling to understand why we are using 2018 figures instead of 2017.
If we take the example below:
Unit sold 2017 = 15
Net Price 2017 = 1
Margin 2017 = 15 * 1 = 15
Unit sold 2018 = 7
Net Price 2018 = 3
Margin 2018 = 7 * 3 = 21
Difference margin = 21 – 15 = 6
And I understand I get the same total in using either 2017 or 2018 figures as the “base”.
1)
Unit sold = (Unit 2018 – Unit 2017) * NetPrice 2018 = -24
Net Price = Unit 2017 * (NetPrice 2018 – NetPrice 2017) = 30
30 – 24 = 6
2)
Unit Sold = (Unit 2018 – Unit 2017) * NetPrice 2017 = -8
Net Price = Unit 2018 * (NetPrice 2018 – NetPrice 2017) = 14
14 – 8 = 6
In the past I used 1) in my job as the figures seemed to make more sense but if I understand correctly you say that 2) is the correct way to do it.
Could you explain a bit further on this?
LikeLike
It is primarily about the base you use which in this case should be 2017 (as prior year is always the base for comparison)
You should not be using 1) as its the complete reverse of 2), and although it gives the same overall result of $6, it overstates the price and volume variances individually.
Take a look at this (using your scenario 1)
Volume:
Total Net Price (I am assuming you mean profit by net price) = 15 units x $1 = $15 in profit for 2017
From your calculation in 1) above, the impact of units change on profit (or net price) = -$24, which means the new profit in 2018 as a result of unit change should be $15-$24 = -$9 (a negative number). But the unit drop from 15 to 7 should not result in a drop in profit to a negative number. Scenario 2) with a drop of -$8 resulting in 2018 profit as a result of unit change of $15-$8 = $7 (a positive number) seems more accurate, isnt it? At a high level, units are almost halved and so is the profit.
Price:
Similarly, the impact of price in scenario 2) is $14, the price increased by $2 (3-1) for 7 units not 15 units.
Hope this helps!
Good question though!
LikeLike
Thanks for that, very useful!
I just wonder if there might be a mistake in the ‘bubble chart’ as it indicates a ‘Mix effect’ of $76 and ‘QTY effect’ of $79, but ‘Sales Mix variance’ has been calculated as $79 and ‘Sales QTY var’ as $76.
One comment as to the calculated Selling Price Impact as to a certain extend it’s impaired as well by volume development as just restated on 2018 volumes.
Example Apples:
SP Impact is calculated as ‘QTY 2018 *(SP 2018 – SP 2018)’ => 60*($11 – $10) = $60.
As quantities 2018 are influenced by business activity and market share changes, it might be worth to split the $60 into ‘Net price impact’ and ‘Price & Volume Var’:
‘Net Price Impact’: (QTY17) * (SP18 – SP17) => 50*($11 – $10) = $50
‘Prive & Volume Var’: (QTY18 – QTY17) * (SP18 – SP17) => (60-50) * ($11 – $10) = $10
Basically this ‘Sales, Price, Mix, Volume – Analysis’ can be applied only for product groups using the same ‘Unit of Measure’ I guess. We do have some product lines where we sell in different UoM, e.g. KG and EACH, which makes it more complex in that case. Is there a reasonable way or workaround to run this analysis even though in one go considering just one data set, or do we have to separate it by Business unit & UoM?
Would be interested in your view as to that.
Thanks and regards
LikeLike
Hi,
the analysis is clear to me – what I would like to understand from you is an advise about how you would isolate the variable costs changes
LikeLike
Will the mix formula work if my unit of measurement is different? Like one is Kgs and other is pieces
LikeLike